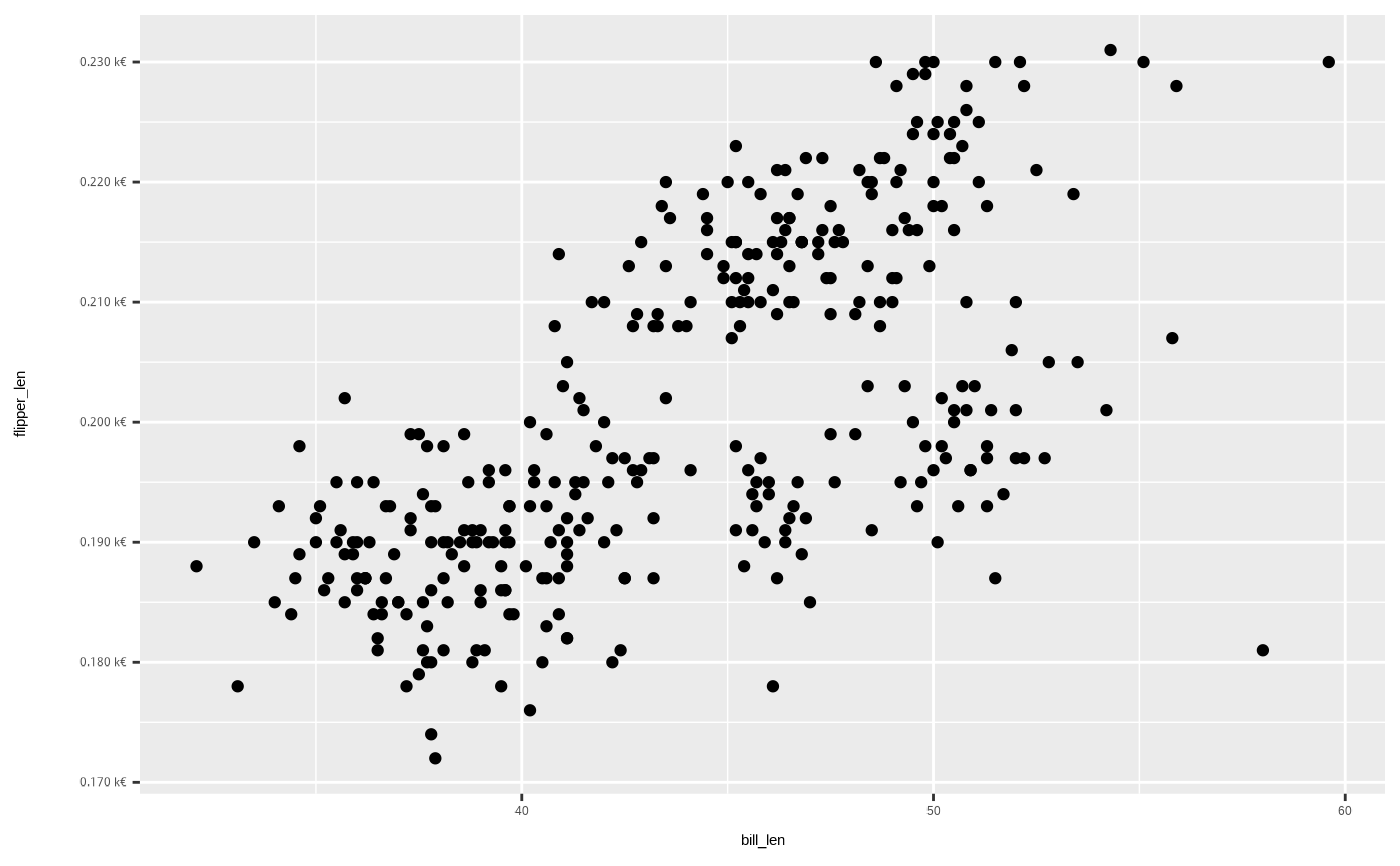
Label y axis in k euros
Examples
if (require("showtext")) {
library(ggplot2)
showtext_auto()
ggplot(penguins, aes(x = bill_len, y = flipper_len)) +
geom_point() +
label_y_keuros()
}
#> Warning: Removed 2 rows containing missing values or values outside the scale range
#> (`geom_point()`).